What's New? Custom Calculators

Make your surveys something to shout about
Make surveys that work flawlessly across devices, without cookie banners, and with reports that are integrated with your research CRM for complete drill-down.

Everything you need to make surveys
Whether you’re collecting customer feedback or monitoring employee satisfaction, Shout has all the features you’ll need to build your surveys quickly and easily.
Worldwide panellists
Reach participants all over the world to power your research.
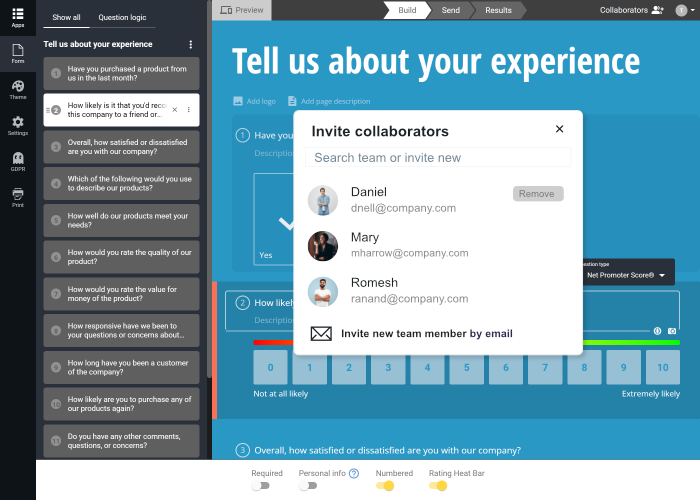
Work as a team
Create surveys and analyze reports with your colleagues.
Personalize journeys
Personalize content with piping and merge tags.
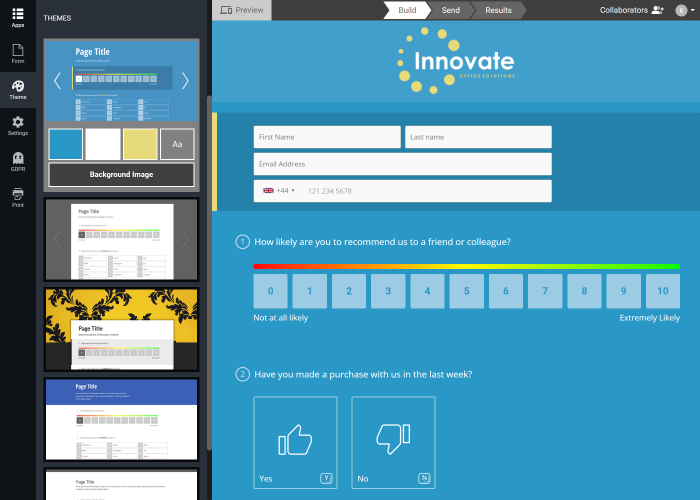
Brand surveys
Customize theme designs to align with your brand guidelines.
Test concepts
A/B test text, images and videos to gauge customer attitudes.
Manage contacts
Keep responses organised within the integrated CRM.
Create
Our survey maker comes with all the features you need to keep completion rates high and drop-out rates low.
Best Reasons To Choose Shout
Collecting feedback to make better business decisions has never been easier. Our intuitive tools are loved by millions of users all over the world.
21+
Years of Experience
3 million +
Happy Users
100%
Satisfaction
Ron Elias
B2B Copywriter -Freelance
“Interactive and really easy to use Software. The builder is seamless, and the question types are perfect. I love the way I can structure surveys in quick and easy way.”
Oana Frant
Consultant – World Bank
“Shout offers multiple options for customization. Moreover, our projects look perfect on any device. If you want a platform that does most of the work for you, including automatic reporting, go with Shout.”
Shout out!
Conduct your own surveys and reach respondents with one flexible app.
Schedule Email Campaigns
Craft bespoke email invitations to send to your survey respondents with our integrated email builder. Monitor the performance of campaigns with industry-standard metrics.
Shout Audience
Our global panel of survey takers is available to complete your survey within days. The online calculator to design and quote for your project instantly.
Your Contact Database
The CRM is core to campaign delivery, data analysis and GDPR consent management. It keeps your project legal and easy to deliver.
Shout Audience
Target survey respondents around the world
Find the best respondents for your surveys using a host of targeting criteria.
Location • Age • Gender • Occupation • Income • Industry • Travel • Health • Hobbies • Education • Much More
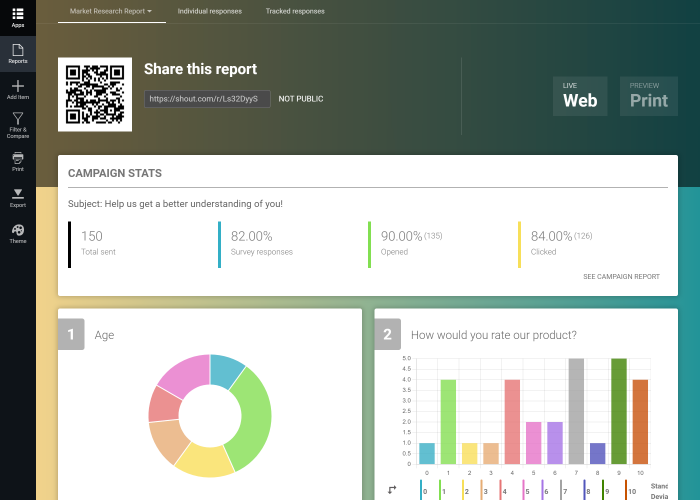
Report
Wield powerful reporting tools to extract every insight.
The perfect survey maker for teams
Collaborate on surveys and reports with your colleagues.
A tried and tested